पाठशाला Pathshala · हिसाब Hisāb, Unit economics · Lesson 17 · Build
Logistics, RTO and returns: the Indian e-commerce tax
An order that never reaches the customer still pays the courier twice and the ad that won it once. Measure return-to-origin and returns by pincode and payment method and stop shipping the orders that lose money.
Pathshala, The Founder Library · 11 October 2026 · 7 min read
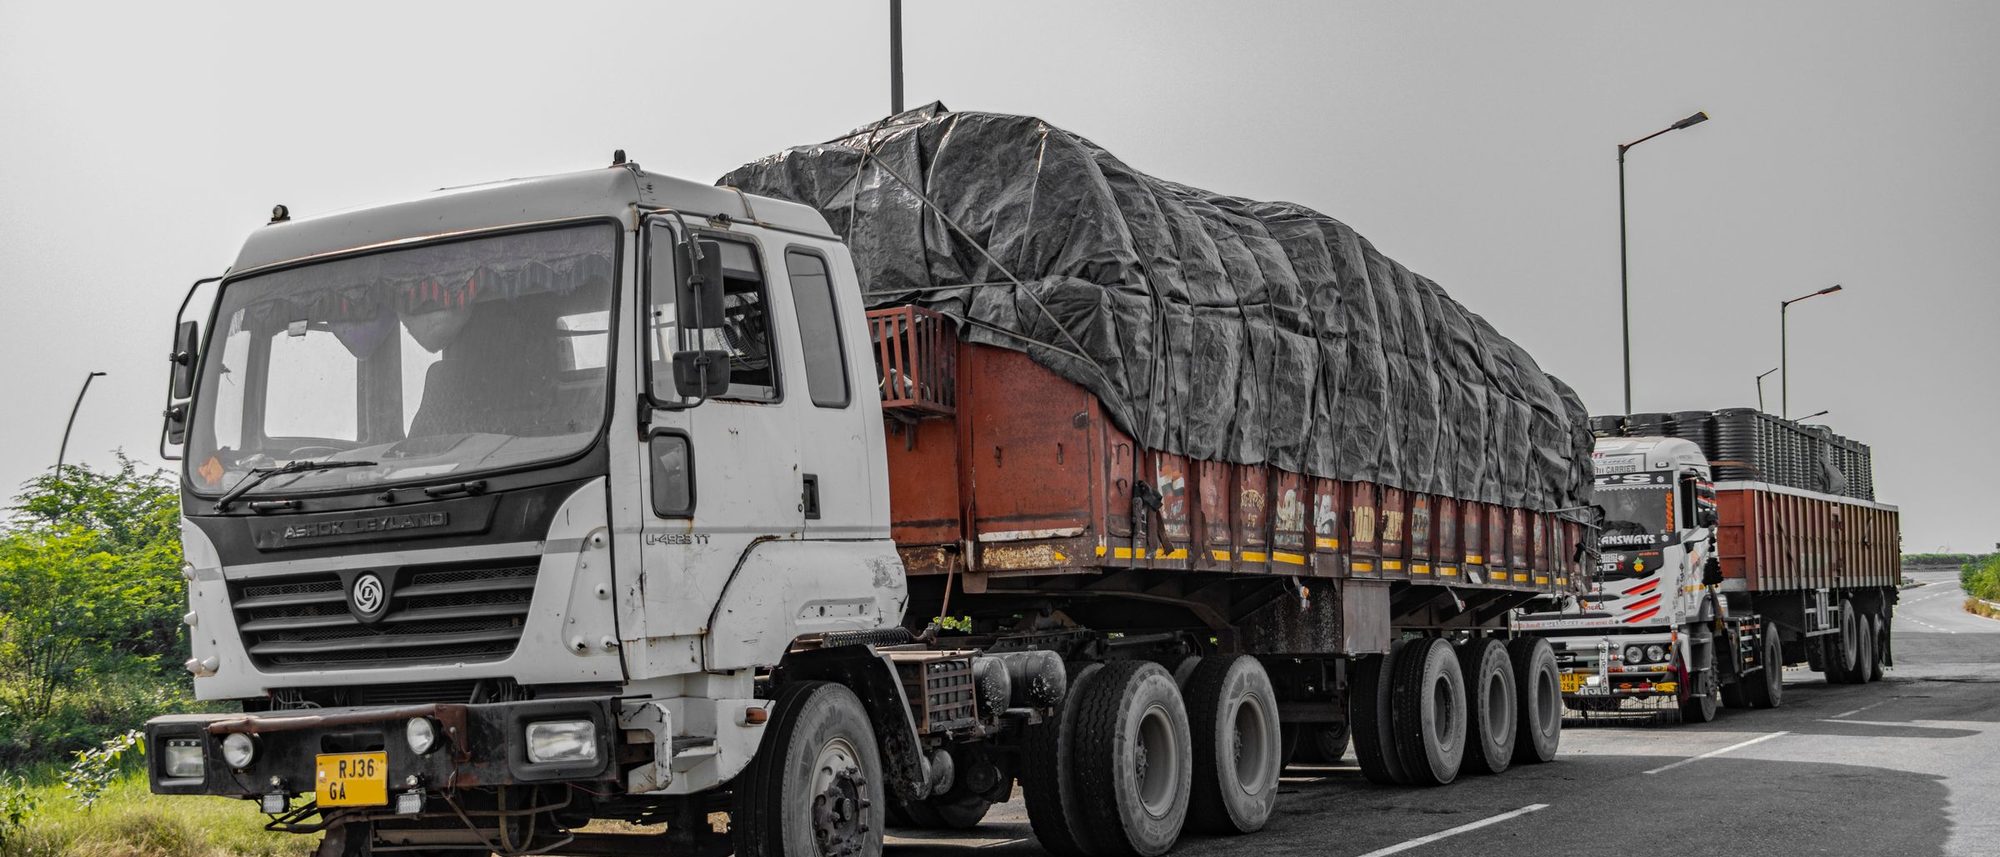
Indian e-commerce pays a tax that American playbooks do not mention. A share of every month’s orders is packed, shipped, carried across the country and carried back again, unopened, because the customer was not home, changed their mind at the door or never meant to buy. The company pays for all of it, and the advertising that produced the order is gone too.
This lesson separates the two losses, prices an undelivered order to the rupee, sets the break-even rate that tells you where cash on delivery stops paying, and gives a method to find the pincodes and payment modes that lose money. The figure is a decision tree to run on each of them.
Two losses with one name
Return-to-origin, RTO, is an order dispatched and never delivered: the customer refused it, could not be reached, gave a wrong address or was not home after the courier’s attempts. It comes back to the warehouse unopened. Almost all of it is cash on delivery, because a customer who has already paid rarely refuses the parcel. A return is an order delivered and then sent back under the returns policy: wrong size, not as pictured, damaged in transit. It comes back opened, sometimes unsaleable, and the customer is refunded.
The two have different causes and different cures. RTO is mostly about intent and reachability before the parcel leaves: a casual click, a fake order, a bad address. Returns are mostly about the product and the listing: fit, photographs, quality. Count them separately. A dashboard that reports one return rate has merged a payments problem with a product problem, and neither will be fixed.
What an undelivered order costs
An Indore brand sells home linen at ₹799 an order ex-GST. Goods cost ₹280, packaging ₹20 and the forward courier ₹65. On cash-on-delivery orders its courier contract adds a ₹30 collection fee on delivered parcels. It spends ₹250 of advertising, on average, for each order placed. A delivered COD order therefore leaves ₹404 of [contribution](/library/contribution-margin-first-number-to-know) before advertising and ₹154 after it.
An RTO order leaves nothing and costs this: the forward courier of ₹65, the return leg, which its contract charges at the forward rate, of ₹65, the packaging of ₹20 that cannot be reused, about ₹14 of goods written off because one parcel in twenty comes back damaged, and the ₹250 of advertising that won the order. That is ₹414 lost on each one. So the brand needs 2.7 delivered COD orders to pay for each one that comes back.
That gives the number that matters: the break-even RTO rate, delivered contribution after advertising divided by that figure plus the loss on an RTO order. For the Indore brand it is ₹154 over ₹568, or 27 per cent. A pincode where more than 27 per cent of COD orders come back loses money on every COD order sent there, on average. Leave the advertising out, as founders often do, and the break-even appears to be 71 per cent, which is why so many brands believe COD is fine.
What the Indian numbers say
Unicommerce, whose software processes orders for many Indian brands and marketplaces, published the clearest public split in its India Ecommerce Index 2023. Returns, as it counts them, were 10.4 per cent of all orders in FY23. Cash-on-delivery orders came back at about one in five, against 5.8 per cent for prepaid orders. Marketplace orders came back at 26.3 per cent against 6.2 per cent on brands’ own websites. The same product sold prepaid on its own site and sold on a marketplace for cash is two different businesses.
The rate can be moved. Unicommerce’s D2C report of April 2026 describes one brand at 39 per cent RTO in November 2025, the festive peak, and 21 per cent by March 2026 after operational changes. The same report finds that tier 2 and tier 3 cities drove 66 per cent of incremental order volume in FY26, which is where cash on delivery remains most common. The growth is where the RTO is. Treating it as a fixed tax gives up a lever.
Cut by pincode and payment method
Export ninety days of shipped orders with five fields each: pincode, payment mode, outcome (delivered, RTO, returned), product and the campaign that won it. Map each pincode to its district and state with the India Post All India Pincode Directory on the government’s open data platform. Then build one table: rows by pincode, columns for orders shipped, RTO rate and return rate for COD and prepaid separately, and expected contribution per order shipped after advertising.
Sort it by total rupees lost, not by RTO rate, because a pincode with sixty orders at 50 per cent matters more than one with eight at 75. Pincodes with fewer than fifty orders in ninety days are too thin to judge alone; pool them by district. In most brands the losses concentrate: a small number of pincode and payment-mode combinations produce most of the rupees lost, and the d2c lesson’s warning that [returns are the Indian line](/library/d2c-unit-economics-order-that-must-make-money) becomes a list of places and causes.
Read the sorted table for three patterns, because each has a different owner. A place pattern shows high COD RTO across many products and campaigns in the same pincodes; that is a payments and reachability problem and the tree below handles it. A product pattern shows one or two products returned far more often than the rest wherever they ship; that is the listing, the size chart or the quality, and it belongs to whoever owns the product. A campaign pattern shows RTO concentrated in orders from one advert or one audience; that campaign is buying clicks from people who do not mean to pay. Ad platforms optimise for whatever event they are told counts as a conversion, so report delivered orders back to them as the conversion rather than placed orders, and the bidding will stop paying for parcels that come back.
Run the tree on the top twenty rows of the table. Most rows end at one of the middle verdicts, confirmation or an advance, which keep the customer and remove the casual order. Only the rows that have been through both and still lose money reach prepaid-only.
An order that comes back unopened still paid for the courier twice and for the ad once. Price it that way and the break-even for cash on delivery is lower than you think.
Fix the order before you block the pincode
Confirm before dispatch. Send every COD order a confirmation message with the address and a one-tap reply, and ship only what is confirmed within a set window. Meta’s WhatsApp Business Platform pricing charges per message from 1 July 2025, and utility templates delivered within an open customer service window are free; check the current rate for India before you budget it. Act on non-delivery reports the same day. When the courier flags a failed attempt, call or message the customer before the next attempt rather than letting the parcel age into an RTO.
Clean the address at checkout. Validate the pincode against the directory, require a landmark and a working phone, and hold orders whose pincode and city do not match. Block repeat refusers by phone number and address. Pay the customer to prepay. A prepaid discount smaller than the expected RTO loss on a COD order is cheap: at a 30 per cent RTO the Indore brand loses about ₹124 per COD order to RTO, so a ₹40 prepaid incentive pays for itself if it converts a fraction of COD buyers. Ask for a small advance where the tree says so. And look at returns separately, by product, with the listing and the size chart in hand: that is a product fix, not a payment one.
The weekly RTO table
Every Monday refresh the pincode table for the trailing ninety days and print the top twenty loss-making rows with their verdict from the tree and the action under way. Track four headline numbers week on week: COD share of orders, COD RTO rate, prepaid RTO rate and return rate by product. Recompute the break-even RTO whenever price, courier rates or advertising cost per order change, because it moves with each.
Once a month, check that every action from four weeks ago has been re-measured and either kept, changed or reversed. Once a quarter, review the prepaid-only pincodes; a new courier partner or a better confirmation flow can bring some back. The table takes thirty minutes a week. It is the difference between paying the RTO tax and choosing where to pay it.
Nothing here is legal, tax or investment advice. The Indore brand is illustrative; your courier contract, not this page, sets what an RTO costs you.
Sources
- Unicommerce, India Ecommerce Index 2023 — Returns at 10.4 per cent of orders in FY23; COD returns about one in five (20.3 and 20.9 per cent on different pages) against 5.8 per cent prepaid; marketplaces 26.3 per cent against brand websites 6.2 per cent.
- Unicommerce, The New D2C Playbook: Insights from April 2026 — One brand’s RTO from 39 per cent in November 2025 to 21 per cent in March 2026; tier 2 and 3 cities 66 per cent of incremental order volume in FY26.
- Open Government Data Platform India, All India Pincode Directory (India Post)
- Meta for Developers, WhatsApp Business Platform pricing (checked October 2026) — Per-message pricing from 1 July 2025; utility templates free within an open customer service window.