पाठशाला Pathshala · विचार Vichār, The idea · Lesson 08 · Start
India 1, India 2, India 3: choose your hundred million
India is three markets sharing a flag. Decide which one you serve before you set a price, choose a channel or size the market, because each one breaks a different assumption.
Pathshala, The Founder Library · 11 October 2026 · 8 min read
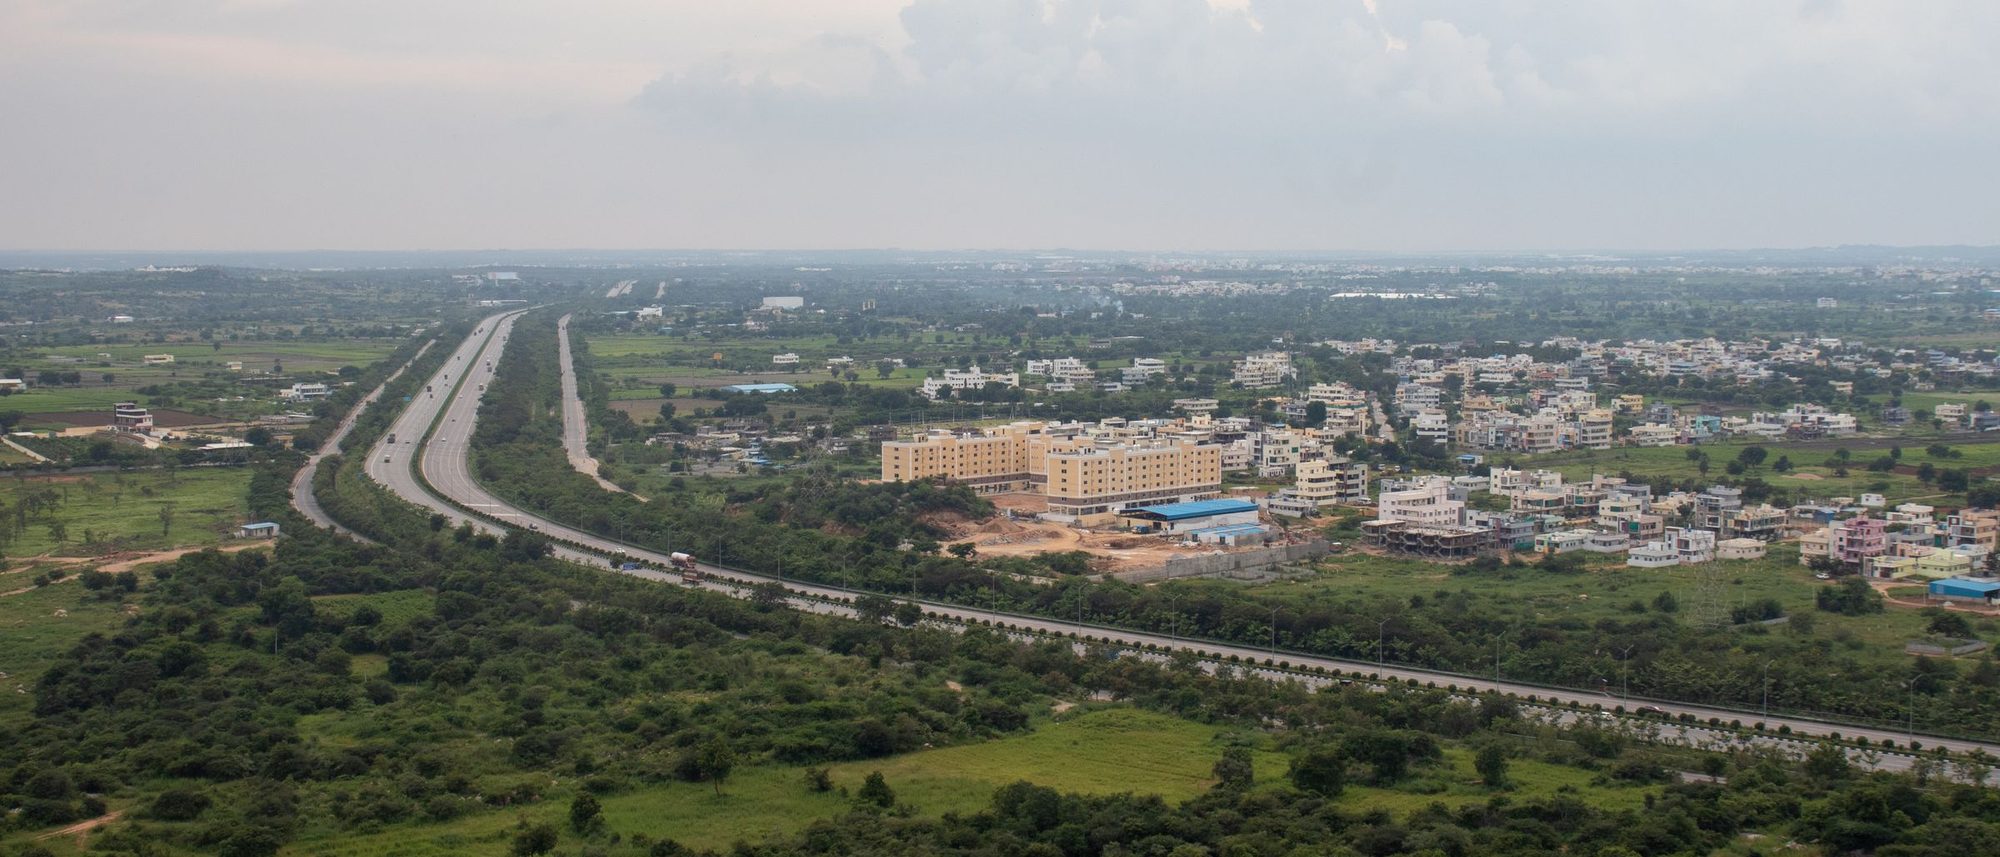
Every Indian pitch deck has a slide with 140 crore on it. Almost no Indian company sells to 140 crore people. It sells to one of three very different countries that happen to share a flag and a currency, and the founders who do well are the ones who decided early which country they were in.
This lesson gives the three countries their sizes, shows what changes between them and ends with a method for choosing. The figure in the middle lets you price the same product in each and watch the business change shape.
Three countries under one flag
The framing comes from Sajith Pai of Blume Ventures, who set it out in The Indus Valley Playbook in January 2021 and has refined it in each year’s Indus Valley Report since. In the 2021 version India 1 was a small consuming class of 110–120 million people across 25–30 million households, earning around $9,000 per person on average: comfortable in English, in white-collar jobs and plugged into the global economy. India 2 was about 100 million people who had just begun to transact digitally. India 3 was everyone else.
The numbers moved. Speaking to the Mercatus Center’s Ideas of India in July 2024, Pai put India 1 at about 130 million people in 30 million households, a Mexico within India by income and spending. India 2 had grown to about 300 million, an Indonesia within India though at a per capita income closer to Nigeria’s. India 3 was still about a billion people at sub-Saharan levels of income. The 2025 report, as reported by The News Minute, puts India 1 at about 14 crore people, the top tenth of the country, accounting for about two-thirds of discretionary spending. It describes that class as deepening rather than widening: the same households are spending more rather than many new households joining them.
The government’s own survey gives the average against which all three sit. The Household Consumption Expenditure Survey 2023–24, summarised in a PIB factsheet of January 2025, put average monthly spending per person at ₹4,122 in rural India and ₹6,996 in urban India. That covers food, rent, fuel, school and everything else. A ₹499 monthly subscription is about seven per cent of the urban average and twelve per cent of the rural one. For India 1 it is a rounding error. For most of India 2 it is a decision the family makes together.
What changes between them
Price. India 1 buys on value and convenience and will pay global-ish prices for things it uses daily. India 2 buys on price per use and asks what it gets for the rupee. India 3 buys in sachets: small amounts, often, with cash or a small UPI payment. A price that is reasonable in one segment is invisible in the second and absurd in the third.
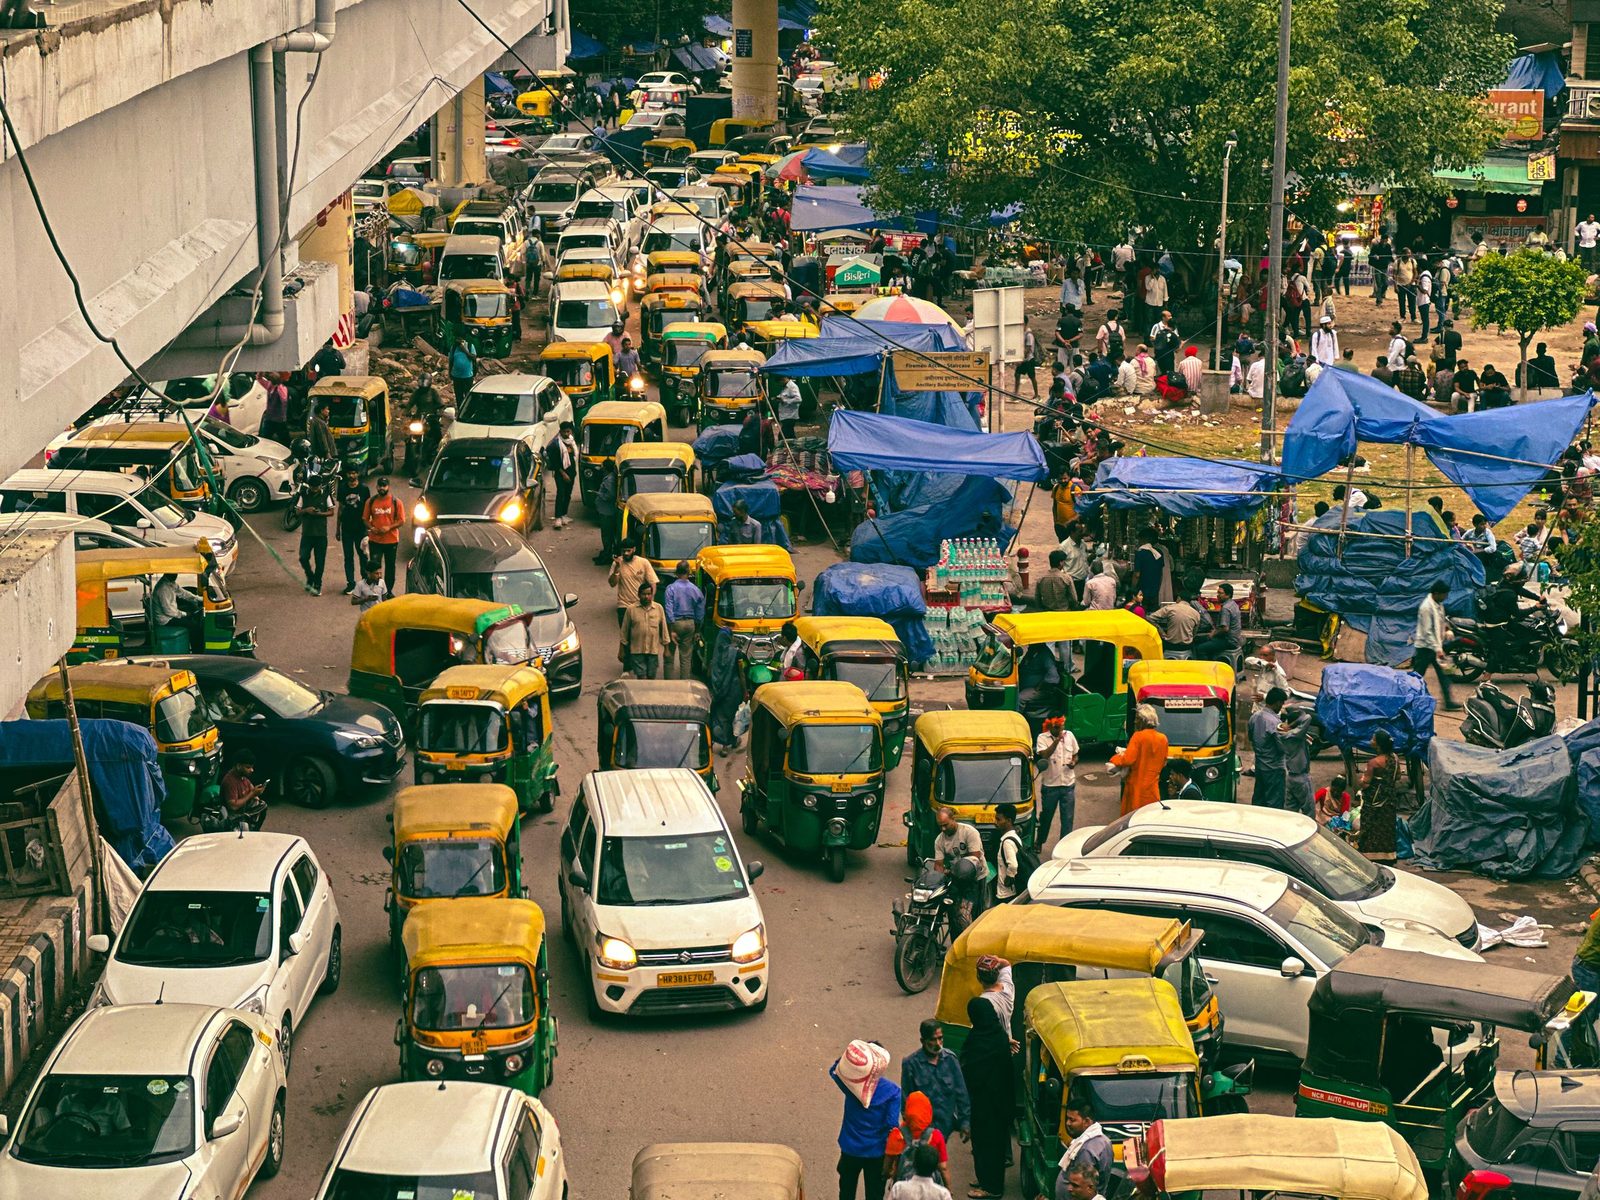
Language and interface. India 1 is comfortable with English text and a dense app. India 2 increasingly lives in video, voice and its own language. India 3 often shares a phone and relies on someone else to help with the first transaction.
Payment. India 1 has cards, mandates and the habit of paying for software. India 2 pays by UPI and prefers one-off payments it can see to subscriptions it has to remember to cancel. India 3 still uses cash for much of its spending and pays digitally where the counterparty insists.
Distribution. India 1 can be reached by performance marketing in English at a cost a subscription can repay. India 2 is reached through vernacular content, creators, referrals and partners it already trusts. India 3 is reached through people: an agent, a shopkeeper, a self-help group, a field force. That last channel is expensive per customer and impossible to replace with an app download.
Willingness to pay for digital things at all. Pai quotes the founder Kunal Shah on India as a place of “millions of free eyeballs, but few that will pay”. That is mostly a statement about India 2 and India 3. India 1 does pay. The trap is to count the eyeballs of all three and the wallets of India 1.
Count the wallets of the India you can reach, not the eyeballs of the India on the census.
Why you cannot serve all three at once
Each segment wants a different product even when the job is the same. Netflix showed what crossing a boundary costs. In July 2019 it launched a ₹199 mobile plan for India: the full library, but in standard definition and on one phone or tablet at a time. That is not a discount. It is a different product designed so that it cannot cannibalise the plan India 1 already bought, with the screen, the resolution and the sharing rules doing the segmentation.
The same logic applies to a startup with a tenth of the resources. A product built for India 1 that tries to sell to India 2 discovers that the price must fall by four or five times while the cost of serving a customer barely moves, because support calls, payment failures and delivery cost the same whoever the customer is. A product built for India 3 that tries to sell up to India 1 discovers that its interface, brand and assisted onboarding read as cheap to the customer it now wants. Pai observed in 2021 that few products have use cases universal enough to play across India 1 and India 2 and 3 together. The ones that did usually started in one segment and earned the right to the next.
A worked example: one app, three plans
A team in Bengaluru builds an app that helps parents track and improve a child’s mathematics between Class 4 and Class 8. The job is the same in every household. Run it through the figure.
As an India 1 product the team prices it at ₹499 a month, sells through Instagram and parent communities in English, and estimates that two per cent of India 1 households with a child of that age would pay. At ₹1,500 to acquire a customer and a 60 per cent margin the payback is five months. The market is small and the economics are fine. The risk is that it is a crowded shelf and the parents already pay a tutor.
As an India 2 product the price has to fall to around ₹99 a month, the content has to be in Hindi, Kannada or Tamil, and the channel is a mix of school partnerships and creators. One per cent take-up of a far larger base produces more customers than the India 1 plan. At ₹250 to acquire each customer and a ₹99 price the payback is a little over four months. That holds only if the 60 per cent margin holds, and the margin holds only if support calls and payment failures are designed out of the product.
As an India 3 product the app is not the product. The product is a ₹19 weekly worksheet delivered through a local tutor or a school, and the business is a distribution business. It may become the largest of the three. It will not look like an app company for years.
Three plans, three companies. None is wrong. Trying to run all three from one roadmap is wrong.
How to choose
Ask four questions and write the answers in rupees and names.

Who pays this month? Not who would benefit. Who, if you shipped a version on Friday, would pay for it before the end of the month, and by what means. If the honest answer is India 1 households, start there even if the larger mission is India 2. Revenue from the first segment pays for learning about the second.
What does it cost to reach one of them? Find the cheapest channel that reaches the segment at all. Performance marketing reaches India 1 well, India 2 erratically and India 3 barely. If the only channel is people on the ground, the business needs a price or a basket large enough to pay for a person’s time.
Is your cost to serve a fixed number or a share of the price? If the cost of a support call, a delivery or a failed payment stays the same in every segment, the cheaper segments will eat your margin unless the product removes those costs. This is the arithmetic that decides whether India 2 is a market or a mirage for you.
Can the segment you start in carry you to the next one? The best first segments create an asset that travels: a brand that India 2 aspires to, content that can be translated, a distribution partner that also serves the next tier. A segment that is a dead end is acceptable only if it is large enough to be the whole company.
Then rewrite the [market sizing](/library/market-sizing-an-investor-will-believe) for the chosen segment alone. India 1 households with a child of the right age, not Indian children. That number is smaller and believable, and an investor who has heard the 140 crore slide a hundred times will notice the difference.
A quarterly ritual: the segment sheet
Keep one sheet with a column for each India and five rows: price the segment will pay, take-up you have actually observed, cost to acquire one customer through your best channel, cost to serve one customer a month, and months to pay back. Fill the column for your chosen segment with real numbers from your own customers every quarter. Fill the other two columns with estimates, and replace each estimate with a number the first time you run a small test in that segment.
Two things will happen. The chosen column will tell you whether the business works where you are, which is the only question that matters this year. And the other two columns will tell you, with evidence instead of ambition, when the next India is within reach. Expanding before that column shows a payback you could live with is how good India 1 companies become poor India 2 companies.
Segment sizes are rounded estimates from the sources below, checked in October 2026, and will keep moving. Nothing here is investment advice.
Sources
- Sajith Pai, The Indus Valley Playbook, January 2021
- Mercatus Center, Ideas of India: Sajith Pai unpacks the 2024 Indus Valley Annual Report, July 2024
- The News Minute, India’s main consuming class is 10% of population (on Blume’s Indus Valley Report 2025), March 2025
- Press Information Bureau, Household Consumption Trends (HCES 2023–24 factsheet), January 2025
- Netflix, Netflix launches mobile plan for India, July 2019